Market Briefing
May 2021
Stock prices moved higher in April with positive average performance across market capitalization sectors. The news headlines during the month continued to reflect economic expansion. The indexes that measure manufacturing and non-manufacturing activity both indicated growth above forecasts. The payrolls report for March also exceeded expectations. Despite the positive headlines there were a couple of negatives as well. Semiconductor shortages caused production delays at auto makers. Existing home sales declined even as prices were rising rapidly. CPI rose in March at a slightly higher than anticipated level. The earnings reporting season for the first quarter kicked off with banks reporting strong results. Generally, a greater than average number of companies reported earnings that were higher than analysts’ estimates. The Federal Reserve kept rates unchanged. Investors favored growth and momentum stocks during the month. Ford’s value/momentum model, sales momentum, estimates revision and earnings surprise were some of the best performing selection factors. Stocks in the value category and those with recent prior period price gains had the weakest results in April. Price/sales, peg ratio, and price gains within the past 6 months were at the bottom of the performance list. More than half of the industry groups we cover had positive average price changes for the month. Notable groups among the best performers were broadcasting, forest products, and restaurants. Share price weakness was seen in drugs and drug stores, the oil sector, semiconductors and transportation issues.
Value of the Market


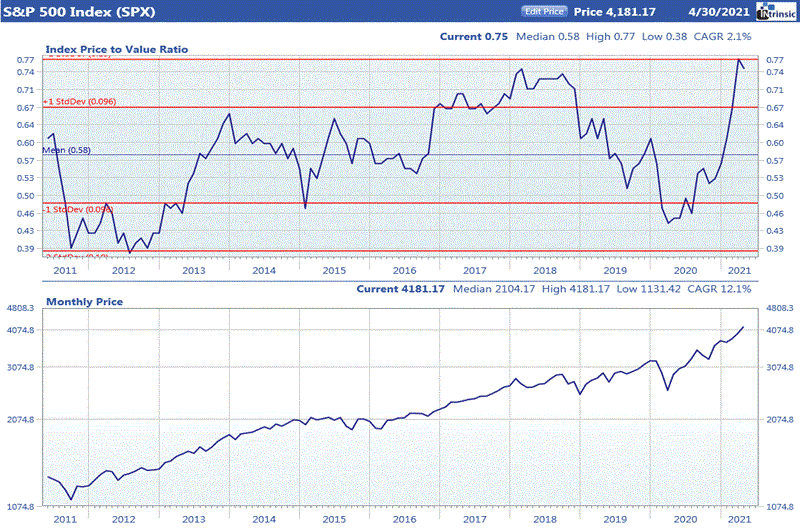
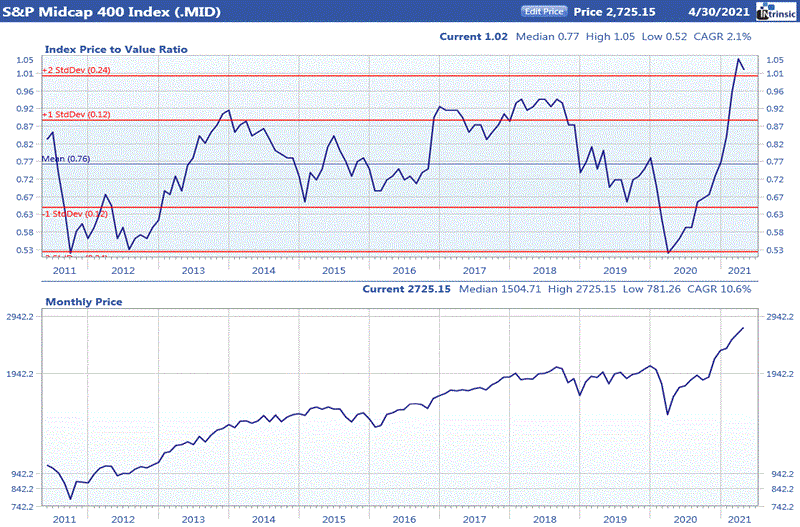
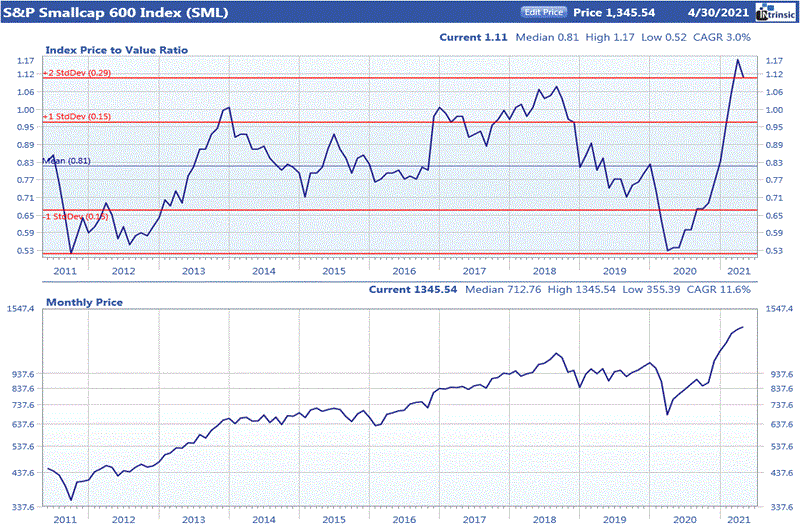
Ford’s price to value ratio (PVA) is computed by dividing the price of a company’s stock by the value derived from a proprietary intrinsic value model. A PVA greater than 1.00 indicates that a company is overpriced while a PVA less than 1.00 implies that a stock is trading below the level justified by its earnings, quality rating, dividends, projected growth rate, and prevailing interest rates. While looking at the PVA for an individual company can give a good indication of its value, the average PVA for the market as a whole can provide insight into current valuation levels.
Source: Ford Equity Research
