Market Briefing
August 2022
U.S. equities enjoyed a strong rebound in July with gains extending across all capitalization sectors. This was despite the expectations of continued Fed rate hikes and persistent high inflation. Economic headlines were mixed. Factory orders were higher for May. Payrolls continued to advance in June, keeping the unemployment rate at 3.6%. Retail sales also posted a rise for June. CPI increased 9.1% in June. Housing continued its decline with lower housing starts and declines in sales of new and existing homes. The Fed raised short term rates by 75 basis points. GDP declined 0.9% for the second quarter. Investors favored more volatile growth stocks during the month. Selection factors including beta, sales growth, and projected growth rate were among the top performers in July. At the same time, the higher quality stocks that have done relatively well in recent months were less favored. Price gains over the past one to six-month period were at the bottom of the factor performance list. Quality factors including Ford Quality Rating, dividend yield, market capitalization and share buyback were also relatively weak performers. In a reversal from the previous month, nearly all the industry groups we track had average price increases in July. Notable rebounds were seen in semiconductors, electrical equipment, hotel & motel and auto and truck manufacturing groups. Tobacco, home appliances and insurance were the groups with negative average price changes. Telecommunications, food industries, and the retail group were also some of the weakest performers for the month.
Value of the Market
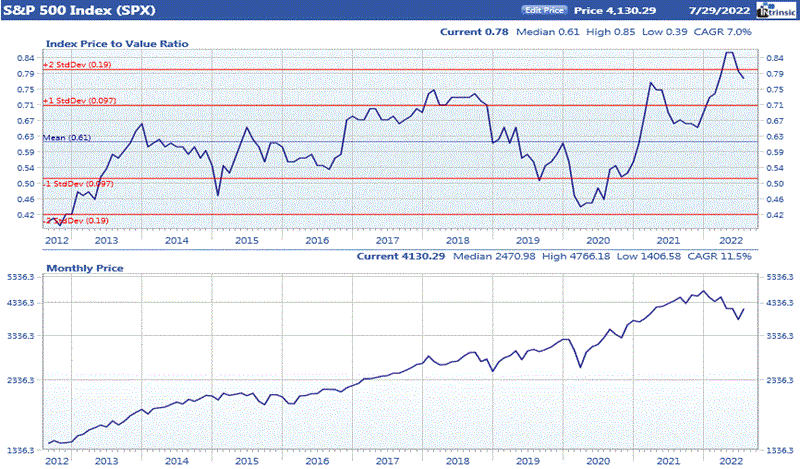
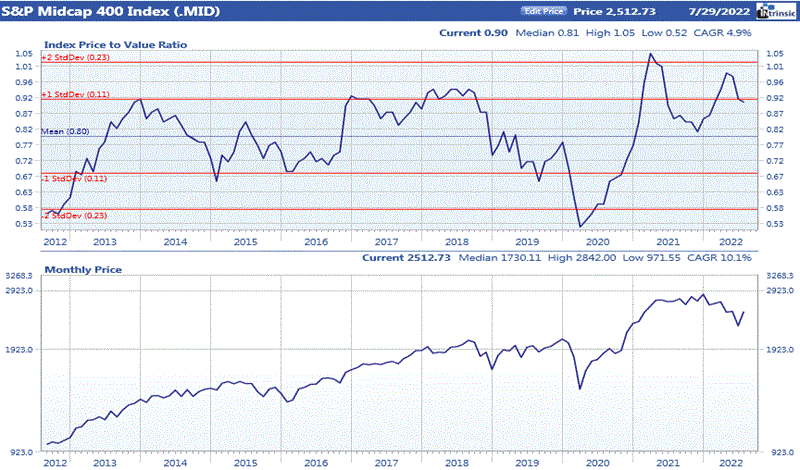
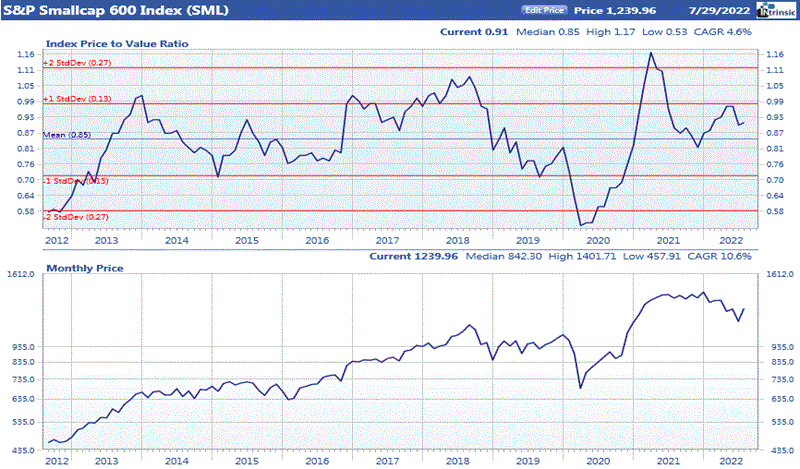
Ford’s price to value ratio (PVA) is computed by dividing the price of a company’s stock by the value derived from a proprietary intrinsic value model. A PVA greater than 1.00 indicates that a company is overpriced while a PVA less than 1.00 implies that a stock is trading below the level justified by its earnings, quality rating, dividends, projected growth rate, and prevailing interest rates. While looking at the PVA for an individual company can give a good indication of its value, the average PVA for the market as a whole can provide insight into current valuation levels.
Source: Ford Equity Research