Market Briefing
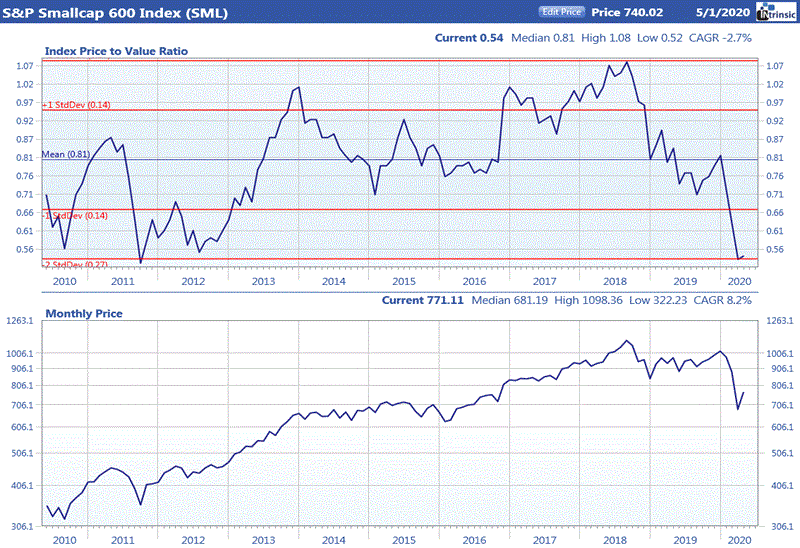
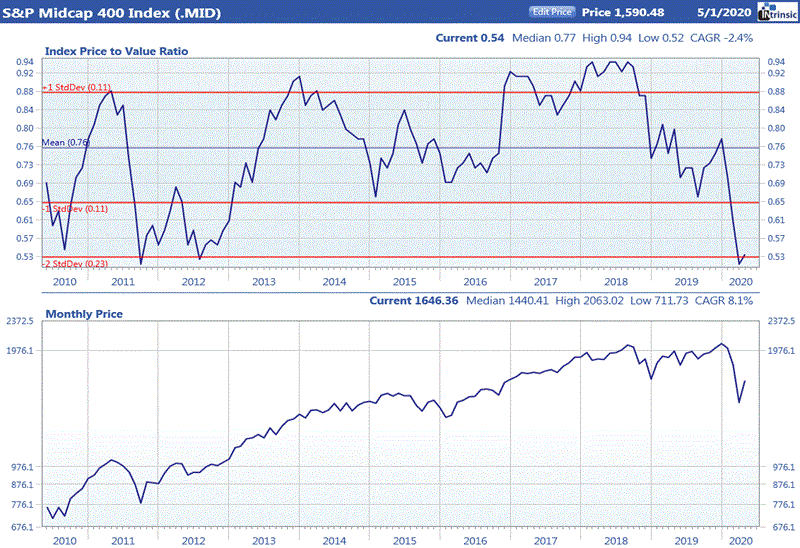
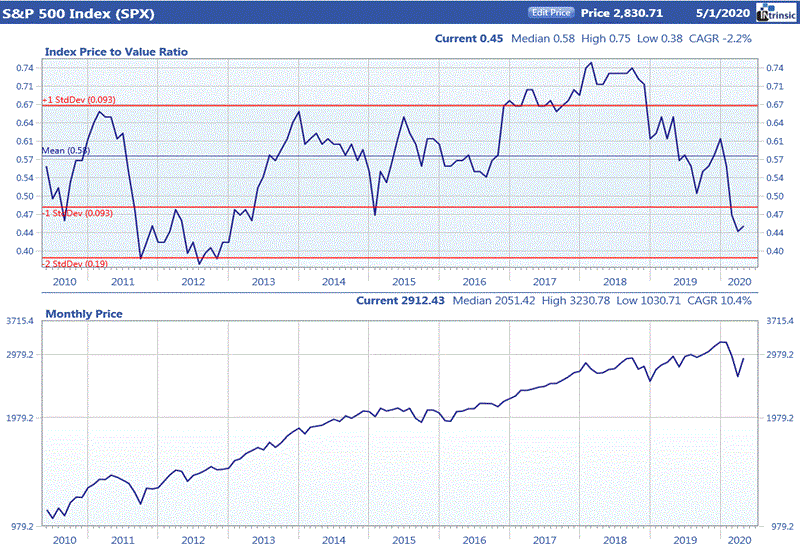
Equity prices staged a solid rebound in April as investors started seeing some positive developments in treatments for Covid-19 and a shift in focus to reopening the economy as light at the end of the tunnel. Economic news during the month was not fully reflective of the impact of the shutdown as many of the figures were based only on activity through March. The exception was unemployment reporting, which reflected a massive number of job losses. Home sales, retail sales, and durable goods orders were all lower in March. GDP contracted by 4.8% in the first quarter. After the big selloff in the prior month investors were looking to pick up some bargains in stocks that had the most severe declines and also those exhibiting low relative valuations. Ford’s price momentum model, which favors past 1-year performance with a recent month decline, was the top performing selection factor. Value measures such as normal p/e ratio, price/value, and peg ratio were also among the best performing factors in April. Higher quality, large cap stocks and those with the best performance over the past month to year were at the bottom of the selection performance list. Nearly all the industry groups we track had positive average price changes. The oil sector, recovering from a dismal March, was at the top of the average price gain list. Other groups with recent price pressure that rebounded in April included restaurants & fast food, specialty retailers, and recreation. Notable among the poorer performing groups were drug stores, electric utilities, and insurance.
Value of the Market


Source: Ford Equity Research
