Market Briefing
February 2021
Equities turned in mixed price performance in January with small capitalization stocks outperforming mid and large caps. The tumultuous political events early in the month had surprisingly little effect on equity markets. However, comments from the FOMC signaling a slowing economic recovery and worries over the pace of COVID vaccinations weighed heavily on the markets late in the month. Despite that, economic headlines in January were mixed. ISM manufacturing and non-manufacturing index reports for December were both above estimates. The housing sector also continued its strong pace. However, employment figures and retail sales reports were disappointing. Investors favored momentum stocks during the month with price momentum, earnings trend and earnings surprise among the top performing stock selection factors. Earnings surprise, earnings trend, projected growth rate and earnings momentum were the top performing factors for the month. High quality, large cap stocks continued to underperform. Likewise, high dividend yield and dividend growth stocks had relatively weak returns for a second month. Although overall market returns were mixed, more than half of the industry groups we cover had positive average price gains for the month. Some outsized gains in individual issues skewed the averages of some industry groups. Some of the best performing groups included retail and apparel, the oil sector and medical related industries. The weakest performing groups were concentrated in the transportation and materials sectors.
Value of the Market
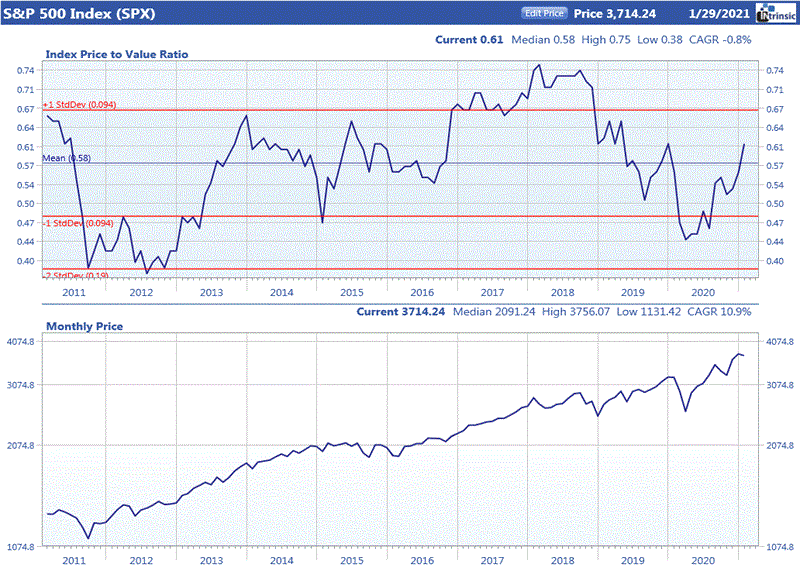
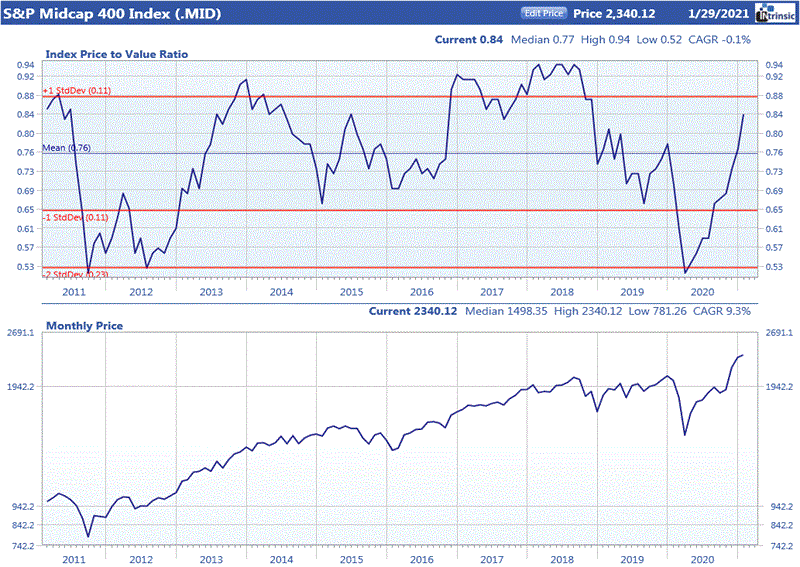
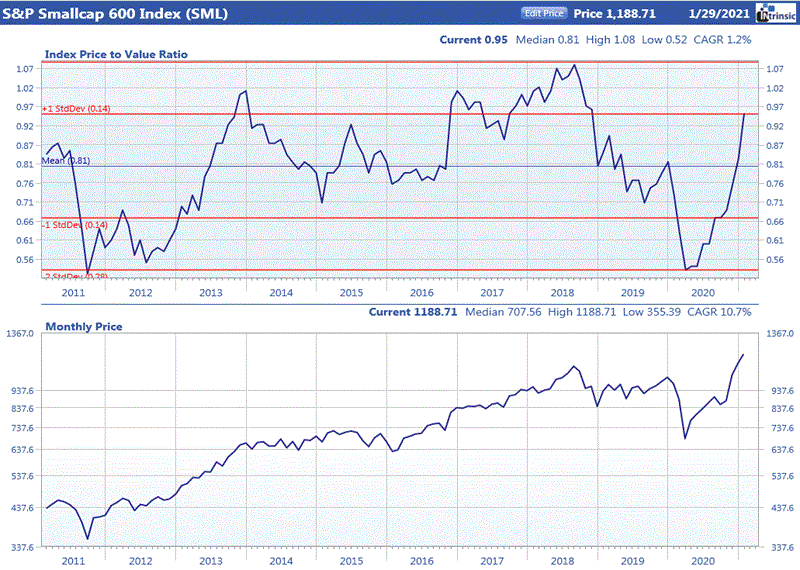
Source: Ford Equity Research