How US Stocks Have Behaved in an Election Month
Presidents are just one factor potentially affecting markets. History going back to 1926 shows returns in months when presidential elections took place don’t reflect any consistent patterns.
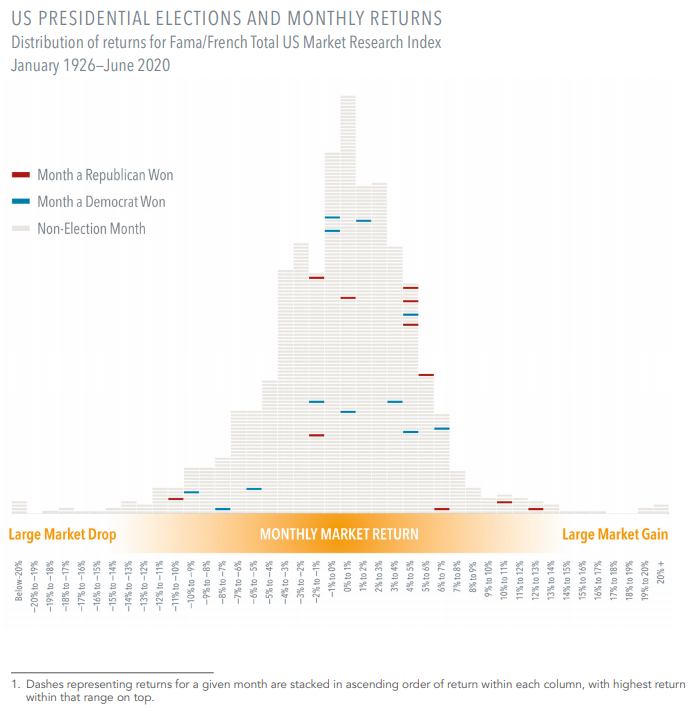
The history of the stock market going back to 1926 shows that returns in months when presidential elections took place don’t reflect any consistent patterns.
- This chart shows monthly returns for a broad-market US index. Each horizontal dash represents a month, arranged from left to right by market return in 1% increments. Blue shows a month when a Democrat won the White House and red a Republican.
- Most election months haven’t produced extreme returns in one direction or the other. And the winning party hasn’t been a reliable driver for the direction or magnitude of market movements in those months.
- During an election cycle, expectations are continuously reflected in current stock prices. Surprises are, by definition, unpredictable—and they don’t always lead to clear-cut investment outcomes.
Many factors can affect stock returns. The history of market behavior during election months makes a strong case for sticking with a plan to achieve long-term goals and minimize costly mistakes.