Market Briefing
November 2020
After a relatively volatile month, stock prices posted a mixed finish for October. Indexes representing the larger capitalization segment of the market ended down for the month while mid and small capitalization indexes advanced. The daily pulse of recovery stimulus spending negotiations in Washington translated to big swings in both directions. Late in the month, hope ultimately faded that a deal would be completed before election day and the equity markets sold off. There was some positive economic news during the month. Manufacturing and services sector indicators continued to show expansion for September. Retail sales, housing starts and durable goods orders were all higher as well. However, a significant uptick in Covid-19 cases weighed negatively on stocks. Investors favored value stocks in October. Stocks selection factors such as p/e ratio, price/book value, peg ratio and price/value ratio were among the top performers for the month. In addition, small and midcap and lower quality stocks outperformed larger cap, high quality stocks. Growth and momentum stocks underperformed as evidenced by projected growth rate, price momentum measures, and sales and earnings momentum factors appearing near the bottom of the performance listing. Roughly half of the industry groups we track had positive average price gains in October. Some of the better performing groups were in the financial and materials sectors. Among these were banks, savings & loans, copper, aluminum and steel. Among the weakest performing groups for the month were certain retailers including department stores and drug stores. Oil related groups and coal posted another down month
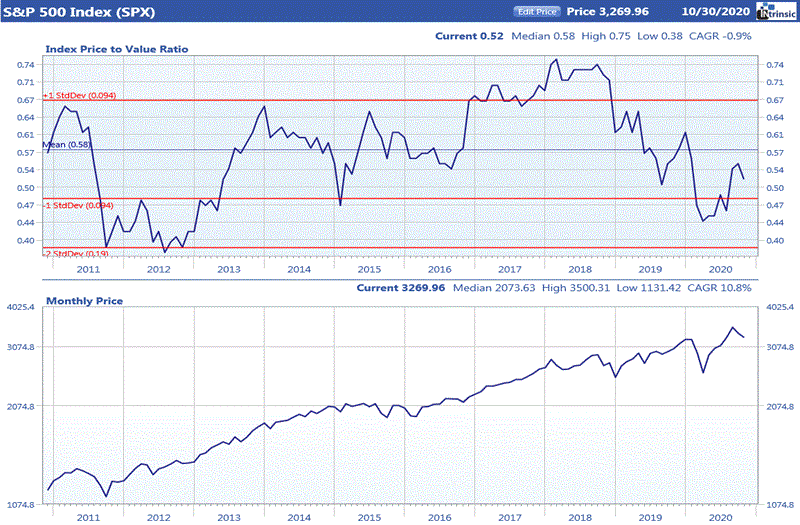
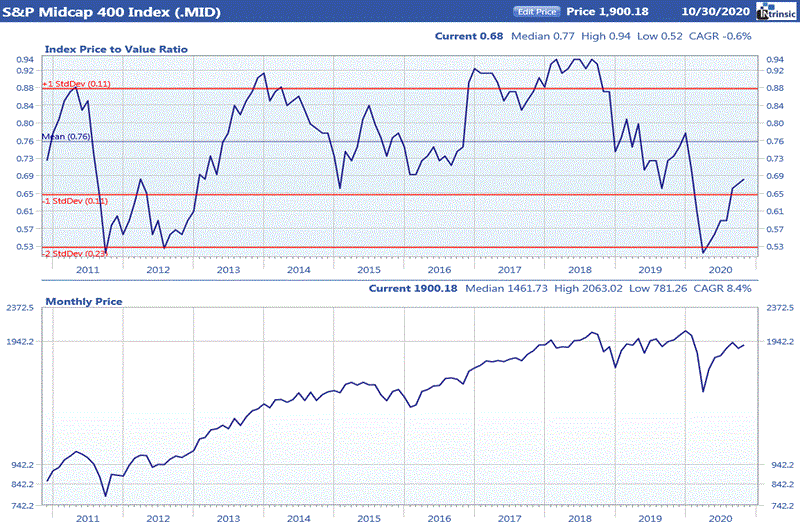
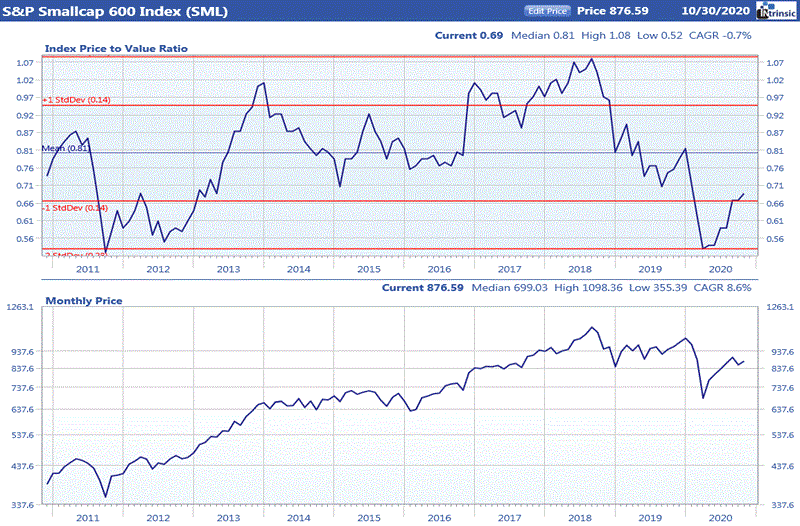
Value of the Market


Source: Ford Equity Research
