Market Briefing
November 2021
Equity indexes posted strong advances in October with large cap stocks outpacing mid and small cap stocks. Economic news headlines were mostly positive for the month. September payrolls came in below estimates. Manufacturing and non-manufacturing indexes continued to indicate expansion. The year over year CPI rate for September was higher. Retail sales continued to advance. Existing and new home sales reports were both higher. Investors favored large capitalization, high price momentum and growth stocks in October. The best price performers over the past 3-month to 5-year periods had strong gains for the month. Sales and earnings growth measures were also among the top selection factors during the month. Value stocks were relatively weaker with price/sales, price/book value, price/earnings and price/cash flow ratios near the bottom of the stock selection performance list. With of the broad advance for October, more than three quarters of the industry groups we cover had positive average price changes for the month. The best performers were in the transportation sector with railroads and trucking near the top of the list. The energy sector with oil and coal industry groups posted another month of strong performance. The semiconductor industry was also a notable among the top average price gainers. Tobacco, telecommunications, and airlines industry groups were among the weakest price performers for the month.
Value of the Market
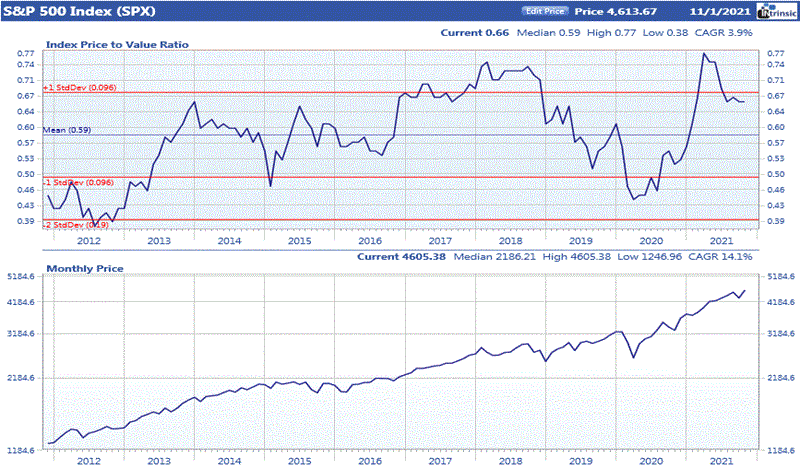
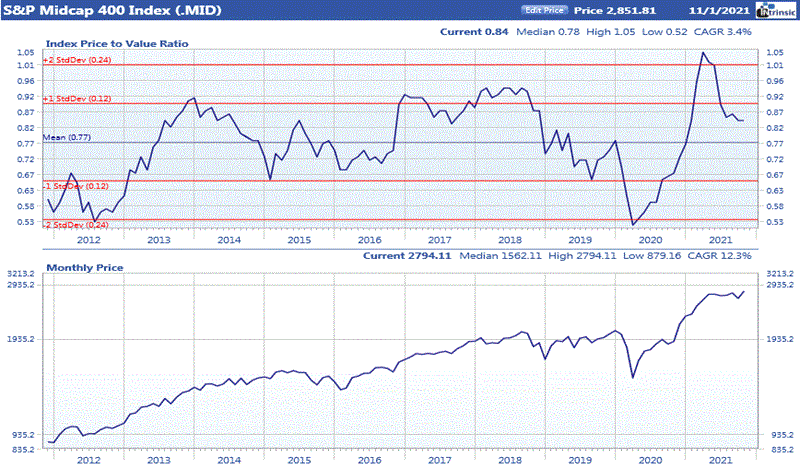
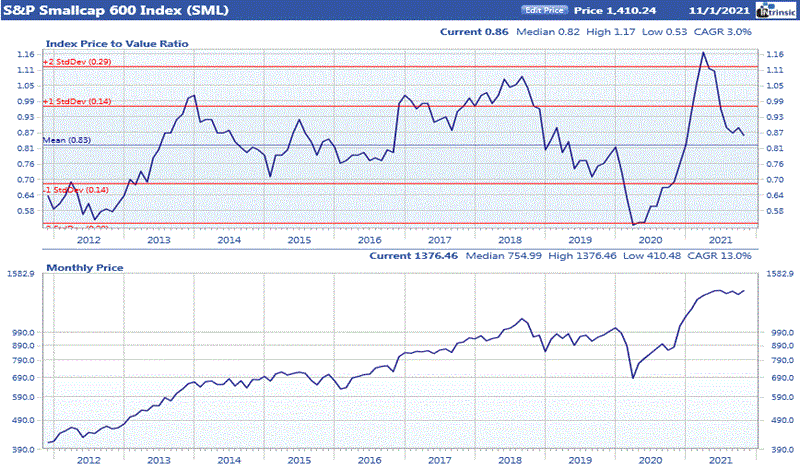
Ford’s price to value ratio (PVA) is computed by dividing the price of a company’s stock by the value derived from a proprietary intrinsic value model. A PVA greater than 1.00 indicates that a company is overpriced while a PVA less than 1.00 implies that a stock is trading below the level justified by its earnings, quality rating, dividends, projected growth rate, and prevailing interest rates. While looking at the PVA for an individual company can give a good indication of its value, the average PVA for the market as a whole can provide insight into current valuation levels.
Source: Ford Equity Research