Market Briefing
March 2022
U.S. equities had mixed results in February with small and mid-cap equity indexes posting modest gains while large caps declined. The negative market reaction to the disappointing earnings forecast from Meta Platforms helped fuel an early month decline. In addition, anticipation of multiple Fed rate increases this year also put a damper on stock prices. However, the buildup of Russian forces and their eventual invasion of Ukraine dominated the headlines and further pressured equity markets. Amidst that, U.S. economic news was still mostly positive. Payrolls had a strong increase in January. Manufacturing and non-manufacturing indexes continued to indicate expansion. Retail sales and durable goods orders were also higher. Inflation continued to be a concern as a 7.5% CPI increase was reported for January. Oil prices rose to more than $95 per barrel. Investors favored momentum stocks in February with earnings trend, sales growth, sales momentum and earnings momentum among the top performing stock selection factors. High market capitalization and quality were among the weakest factors. Roughly half of the industry groups we cover had positive average price changes for the month. The top performing groups were in the materials and energy sectors. Aerospace was also a notable strong performing group. Among the poorest performing groups were tire & rubber, drug stores and home furnishings.
Value of the Market


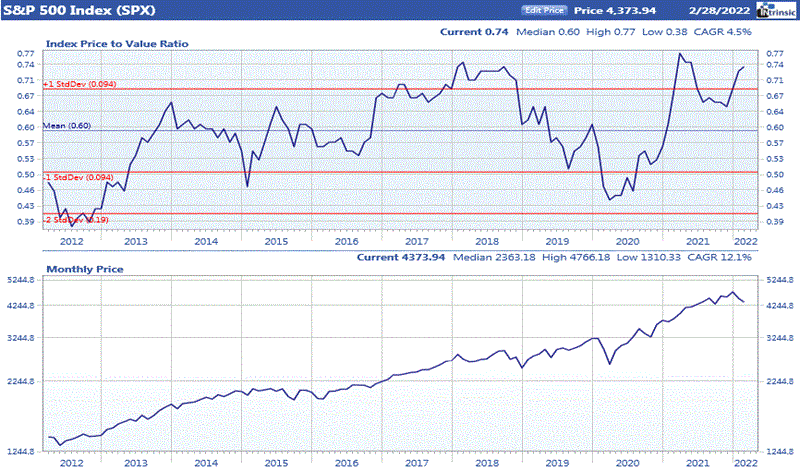
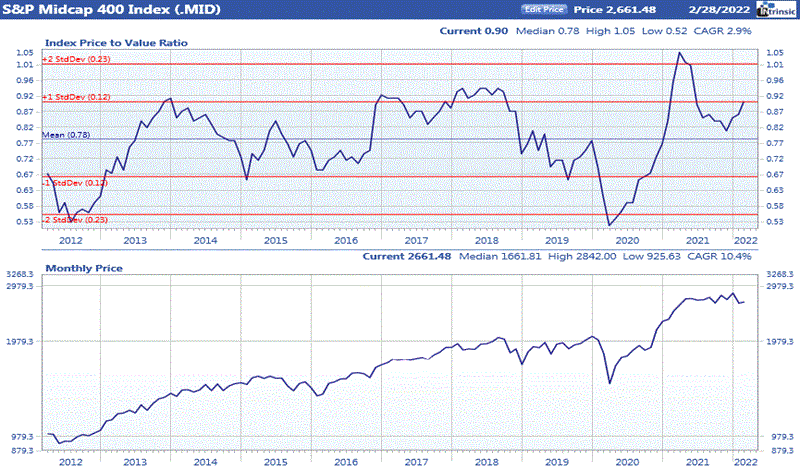
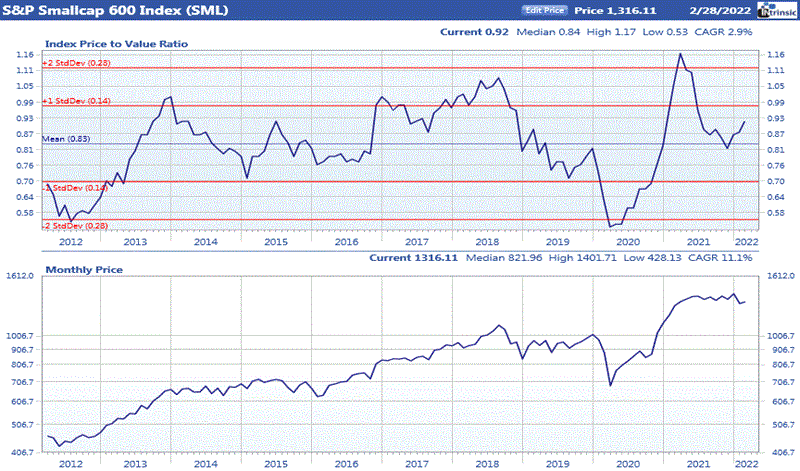
Ford’s price to value ratio (PVA) is computed by dividing the price of a company’s stock by the value derived from a proprietary intrinsic value model. A PVA greater than 1.00 indicates that a company is overpriced while a PVA less than 1.00 implies that a stock is trading below the level justified by its earnings, quality rating, dividends, projected growth rate, and prevailing interest rates. While looking at the PVA for an individual company can give a good indication of its value, the average PVA for the market as a whole can provide insight into current valuation levels.
Source: Ford Equity Research
