Market Briefing
June 2022
After some sharp daily declines, U.S. equities rallied back toward the end of the month to finish higher in May. Small and mid-cap stocks fared better on average than large caps. As inflation concerns continued to weigh on the market, economic headlines pointed to areas of weakness. Manufacturing and non-manufacturing indexes, while still showing expansion, were lower than prior months and below estimates for April. Retail sales were up in April. However, disappointing results from key retailers drove stock prices lower. Existing and new home sales declined. As was widely expected, the Fed raised interest rates by 50 basis points. While CPI declined to an 8.3% annual rate, the drop was lower than estimated, leading to concerns that the Fed would need to enact more aggressive monetary tightening. Investors continued to seek out value stocks during the month. Dividend yield, operating earnings yield, p/e ratio, and price/cash flow were among the top performing stock selection factors in May. For a second month, high growth stocks were less favored with projected growth rate, earnings surprise and 1-year sales growth among the worst performing factors. About half of the industry groups we cover posted positive average price gains during the month. The energy sector continued its recent roll as oil industry groups made up most of the top average performers. Other notable above average performance was seen in utilities and telecommunications. Among the weak performing groups were agricultural machinery, retailers, and drugs.
Value of the Market


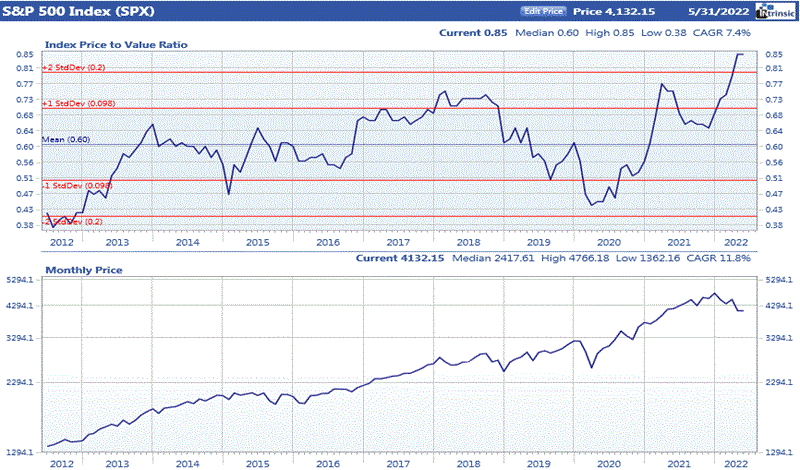
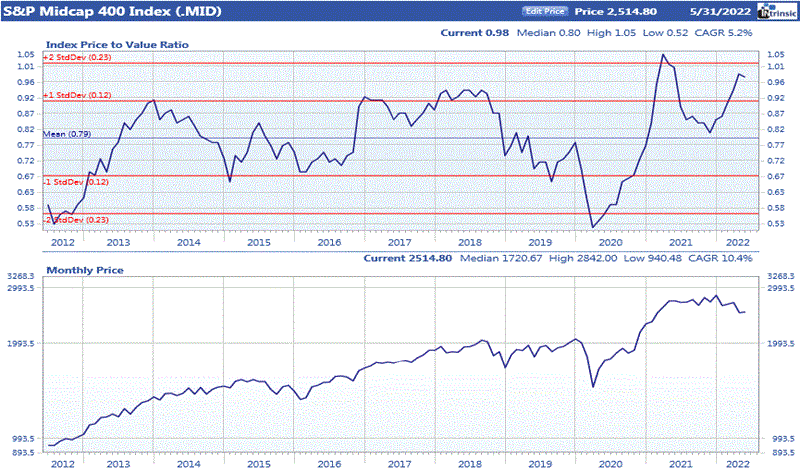
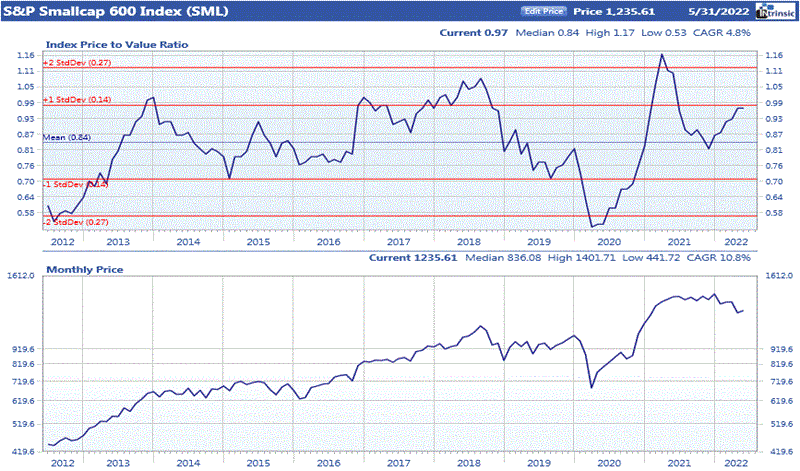
Ford’s price to value ratio (PVA) is computed by dividing the price of a company’s stock by the value derived from a proprietary intrinsic value model. A PVA greater than 1.00 indicates that a company is overpriced while a PVA less than 1.00 implies that a stock is trading below the level justified by its earnings, quality rating, dividends, projected growth rate, and prevailing interest rates. While looking at the PVA for an individual company can give a good indication of its value, the average PVA for the market as a whole can provide insight into current valuation levels.
Source: Ford Equity Research
